
The State of CI/CD Security 2026: 15k+ Public Pipelines, Graded
Every dependency you install was built by someone else’s pipeline. We graded 15k+ of those pipelines, continuously and in public. Nine out of ten carry a High or Critical risk right now.
The numbers
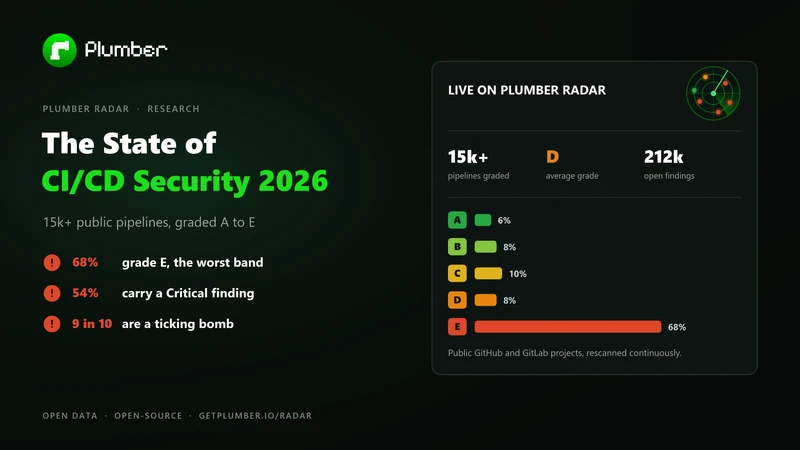
In one line: the average public pipeline scores a D, only 3% come back clean, and none of it requires a zero-day to exploit.
How we graded it
- Plumber Radar continuously scans public GitHub and GitLab projects.
- Each one is analysed by the open-source Plumber CLI, which reads the pipeline configuration and the repository settings.
- It computes a Plumber Score: every scan starts at 100 points, findings subtract by severity, and a single Critical finding forces an E.
- The scanner is open source, the scoring algorithm is public, and every grade is per-project and verifiable.
- The dataset is Plumber Radar itself. Every number in this article is an aggregate over the public dashboard: each project behind it is a row you can open, with its grade and findings.
This is not a survey of what teams say they do. It is what their repositories actually contain. Full cohort-selection details and caveats are in the methodology.
CI/CD is still a blind spot
Application code gets reviewed. Dependencies get scanned. The pipeline that builds and ships both gets neither.
- It belongs to nobody in particular. Pipeline security sits between the platform team and the security team, and is rarely anyone’s explicit job.
- 2,863 repositories have no CI at all and still surfaced with findings, because governance risk like an unprotected branch exists with or without a pipeline.
- Even the best cohort is not clean. Half the A-graded projects still carry one open finding.
- Offense is already automated. The hackerbot-claw campaign compromised 5 of 7 targeted repositories using nothing but misconfigurations documented for years.
How bad it is
Every project is graded A to E. Most of open source ships at the bottom of that scale.
76% grade D or E, the cohort average is a D, and the median project has 5 open findings.
Grades summarise. Severity is the part that decides whether an incident is survivable. Sort every project by its single worst open finding and 91% carry a High or Critical risk:
A privileged container, a secret reachable from a fork, a security gate switched off.
Serious exposure sitting one step below Critical, and just as unreviewed.
Usually undeclared workflow permissions, the most common finding in the whole cohort.
No open findings of any severity. Four hundred and thirty-three projects out of 15k+.
Where the risk actually sits
Pipeline risk is not one problem. It concentrates in a handful of recurring patterns, and the same ones show up again and again across the whole cohort.
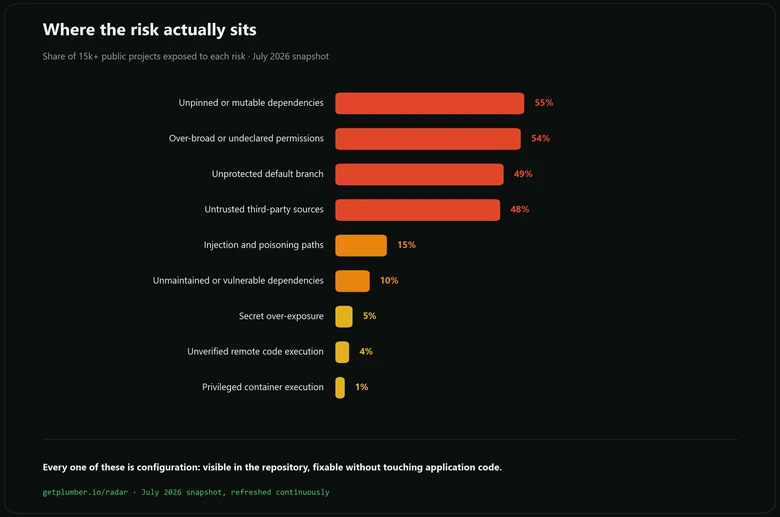
A tag or branch can be moved under you. The code you reviewed is not the code that runs tomorrow.
Default tokens can push code, publish packages and edit releases. Most pipelines never narrow them.
The branch releases ship from accepts force pushes, or merges with no review required.
Third-party code and images pulled from outside any trust policy, running with full access to the job.
Attacker-controlled text reaching a shell, or a build cache an outsider can write into.
Archived actions, published CVEs, and commits impersonating a trusted author.
Entire secret contexts handed to workflows, or debug tracing that prints them into logs.
curl piped straight into a shell. The Shai-Hulud propagation pattern, still alive.
The top four are the dangerous ones, because they combine. An unpinned action, pulled from an untrusted source, running with default write permissions, on a branch nobody protects: that is the exact shape of the tj-actions/changed-files compromise.
Popularity is not protection
The comfortable assumption is that widely-used projects earn their trust: more eyes, more maintainers, better hygiene. The data says otherwise.
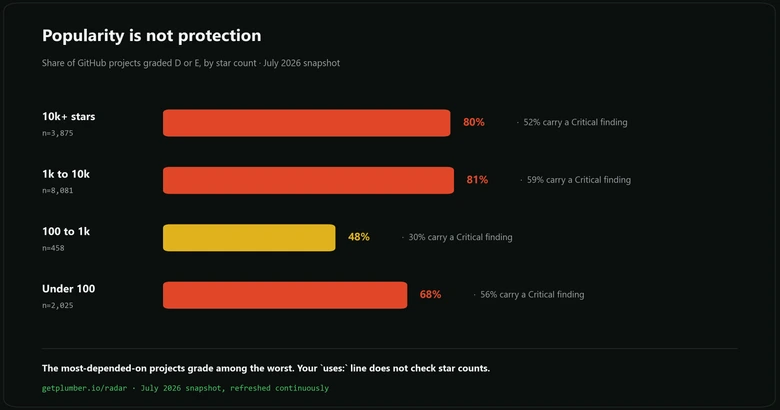
- Above 10k stars, 80% grade D or E and 52% carry a Critical finding.
- The healthiest band is the unglamorous middle (100 to 1k stars): 48% D or E, and 22% earn an A.
- When you adopt a popular action or library, you inherit its pipeline, not its stars: the unpinned dependencies it builds with, the permissions its workflows run with. Stars measure adoption, not the thing that gets you compromised.
What good looks like
934 projects earn an A. Compare them to the whole cohort and the best-practice list stops being advice and becomes a measurement:
The single sharpest divide in the dataset. An unpinned action costs too many points to keep an A.
Every action an A project runs comes from a source inside a trust policy.
No force pushes, review required before merge, on the branch releases ship from.
The one habit even the A cohort has not finished adopting: it is a Medium finding, so an A survives it.
The first three read as 100% because the grade enforces them: a finding there is High or Critical, and a single Critical forces an E. That is the point of the score. The practices that matter most are exactly the ones an A-graded project cannot skip.
Nothing on that list needs a security team or a budget. For most projects it is an afternoon of configuration.
Grade your own pipeline
- Get your grade. Install the Plumber CLI (
brew install getplumber/plumber/plumber) and runplumber analyze. The grade appears immediately, and--score-pointshows where every point went. - Publish it. Add
score-push: true(GitHub) orscore_push: true(GitLab) to get a verifiable score page. - Check your dependencies. Look them up at
score.getplumber.io/<host>/<owner>/<repo>, or browse the live cohort on Plumber Radar.
If your grade comes back a D or an E, you are in the majority. The difference is that now you know, and the fix list is short.
Key takeaways
- 91% of public projects carry a High or Critical risk right now, and 54% carry a Critical one.
- 68% grade E, 76% grade D or E, and the average is a D. Only 3% are clean.
- The risk concentrates in four patterns: unpinned dependencies, over-broad permissions, unprotected branches, untrusted sources. They combine into real attack paths.
- Popularity is not protection: 80% of GitHub projects above 10k stars grade D or E. Check a dependency’s score, not its stars.
- CI/CD is a blind spot: governance risk exists even without a pipeline, and it is rarely anyone’s explicit job.
- All of it is configuration. No zero-days required, to attack it or to fix it.
FAQ
What is the state of CI/CD security in 2026?
Measurably poor. Across 15k+ public GitHub and GitLab projects graded by Plumber Radar in July 2026, 68% score E (the worst grade, reserved for Critical findings), 76% score D or E, and the average is a D. 91% carry a High or Critical finding, and 54% carry a Critical one.
How were the pipelines graded?
With the open-source Plumber CLI, which reads each project’s pipeline configuration (.gitlab-ci.yml, .github/workflows/*.yml) and repository settings, evaluates them against pipeline-security and governance controls, and computes an A to E Plumber Score. Every scan starts at 100 points, findings subtract by severity, and one Critical finding forces an E. The scanner and the scoring specification are open source, and every grade is public on Plumber Radar.
What are the most common CI/CD security risks?
Four dominate: unpinned or mutable dependencies (55% of projects), over-broad or undeclared permissions (54%), unprotected default branches (49%), and untrusted third-party sources (48%). Behind them sit injection and cache-poisoning paths (15%), unmaintained or vulnerable dependencies (10%), secret over-exposure (5%) and unverified remote scripts (4%).
Why do popular projects score worse?
Among GitHub projects with more than 10k stars, 80% grade D or E and 52% carry a Critical finding, worse than mid-size projects (the 100 to 1k star band is the healthiest, with 22% earning an A). Large projects accumulate more workflows, more third-party actions and more legacy configuration, and pipeline security is rarely anyone’s explicit responsibility. Stars measure adoption, not the safety of the pipeline that ships the code.
Why is CI/CD a blind spot?
Application code is reviewed and dependencies are scanned, but the pipeline that builds and ships them usually belongs to nobody in particular. Governance risk exists even without a pipeline: 2,863 repositories in the cohort have no CI at all and still surfaced with findings such as an unprotected default branch.
Is any of this hard to fix?
No. Every risk measured here lives in configuration files and repository settings. Pinning dependencies, declaring permission scopes, protecting the default branch and dropping privileged escape hatches is typically an afternoon of work, with no application code changes.
How do I check my own project’s grade?
Run plumber analyze from your repository with the free, open-source Plumber CLI; the grade appears in the terminal immediately. Add score-push: true (GitHub) or score_push: true (GitLab) to your CI to publish a score page at score.getplumber.io/<host>/<owner>/<repo> that anyone can verify.
Can I verify or reproduce these numbers?
Yes. The headline statistics come from the live Plumber Radar dashboard, which is public and refreshed continuously, so current figures will drift from this July 2026 snapshot as projects change. The scanner, the scoring algorithm, and every per-project grade are public, so any number can be re-derived by running the CLI against the same repository.
Study metadata
- Snapshot: July 20, 2026 · public projects on github.com and gitlab.com
- Source dataset: the live Plumber Radar dashboard. Every aggregate in this article can be re-derived from it, and every project behind the numbers is a public row with its grade and findings
- Cohort: 15k+ graded projects. The sample is overwhelmingly GitHub, with a smaller GitLab cohort of roughly 570 projects. First-party platform namespaces, archived repositories, forks and known-broken mirrors are excluded
- Cohort selection: the GitHub cohort is curated toward the most-starred public repositories (83% of it sits above 1,000 stars), extended with every project submitted for an on-demand scan on Radar; the GitLab cohort is public gitlab.com projects with 30+ stars and recent activity, plus on-demand submissions. Neither is a random sample of all public repositories: the study describes the popular, active end of open source
- “A cohort vs overall” comparisons are measured on GitHub projects: with a pipeline for pinning, sources and permissions; all repositories for branch protection
- Risk categories group the equivalent controls from both platforms (for example “unpinned or mutable dependencies” covers unpinned actions and mutable container image tags), and are measured as the share of the whole cohort exposed to at least one control in the category
- Pipeline risks are measured on projects that have a pipeline; governance risks such as branch protection are measured on every repository, including those without CI
- Scanner: Plumber CLI
v0.4.8, default policy - Branch protection is only measurable on GitHub in this scan
- The GitLab-only predecessor of this study: The State of GitLab CI/CD Compliance 2026
Related Resources
The live dashboard behind this report, refreshed continuously
Plumber Score: A Security Standard for CI/CD PipelinesHow the A to E grade works and why it is built to be a standard
hackerbot-claw: CI/CD Pipelines as Attack SurfaceAn AI bot compromised 5 of 7 major repos via known misconfigurations
The tj-actions/changed-files Supply Chain AttackThe incident that made unpinned third-party actions everyone’s problem